
Nueces River Water Quality Update — September 26, 2025
Overview
Monitoring of the Nueces River continues to show variability in salinity and total dissolved solids (TDS) levels at key points between the upper river and the saltwater barrier dam. Today’s readings were taken across seven locations, ranging from the upstream baseline area near the Eastern Well Field to the freshwater and saltwater sides of the dam.
USGS data from the Bluntzer monitoring station also shows continued steady river stage increases, along with consistent water quality readings.
USGS Monitoring Data — Nueces River at Bluntzer (Station 08211200)
Date/Time: September 26, 2025 — 12:45 PM CDT
Gage Height: 7.17 ft
Discharge: 82.2 cubic feet per second
Specific Conductance: 1280 µS/cm @ 25°C (approximately 832 mg/L TDS)
pH: 8.2
Dissolved Oxygen (DO): 7.7 mg/L
Temperature: 84.9°F
Precipitation (24-hour): 0.25 inches
The data indicates that the Nueces River at Bluntzer has risen approximately 0.5 feet over the past week, with stable pH and dissolved oxygen levels.


Field Measurements — September 26, 2025
Upstream Baseline (11:46 AM)
Salinity: 0.6 ppt
TDS: 839 mg/L
Temperature: 85.5°F
Discharge at Well Cluster (2:05 PM)
Salinity: 3.1 ppt
TDS: 3,784 mg/L
Temperature: 81.3°F
Hazel Bazemore Boat Ramp (1:06 PM)
Salinity: 1.0 ppt
TDS: 1,246 mg/L
Temperature: 85.3°F
Near Wood River Subdivision (12:43 PM)
Salinity: 1.0 ppt
TDS: 1,273 mg/L
Temperature: 89.0°F
Wood River Spring/Ground Seep (2:05 PM)
Salinity: 4.3 ppt
TDS: 5,050 mg/L
Temperature: 86.4°F
Freshwater Side of Saltwater Barrier Dam (4:10 PM)
Salinity: 1.0 ppt
TDS: 1,279 mg/L
Temperature: 86.1°F
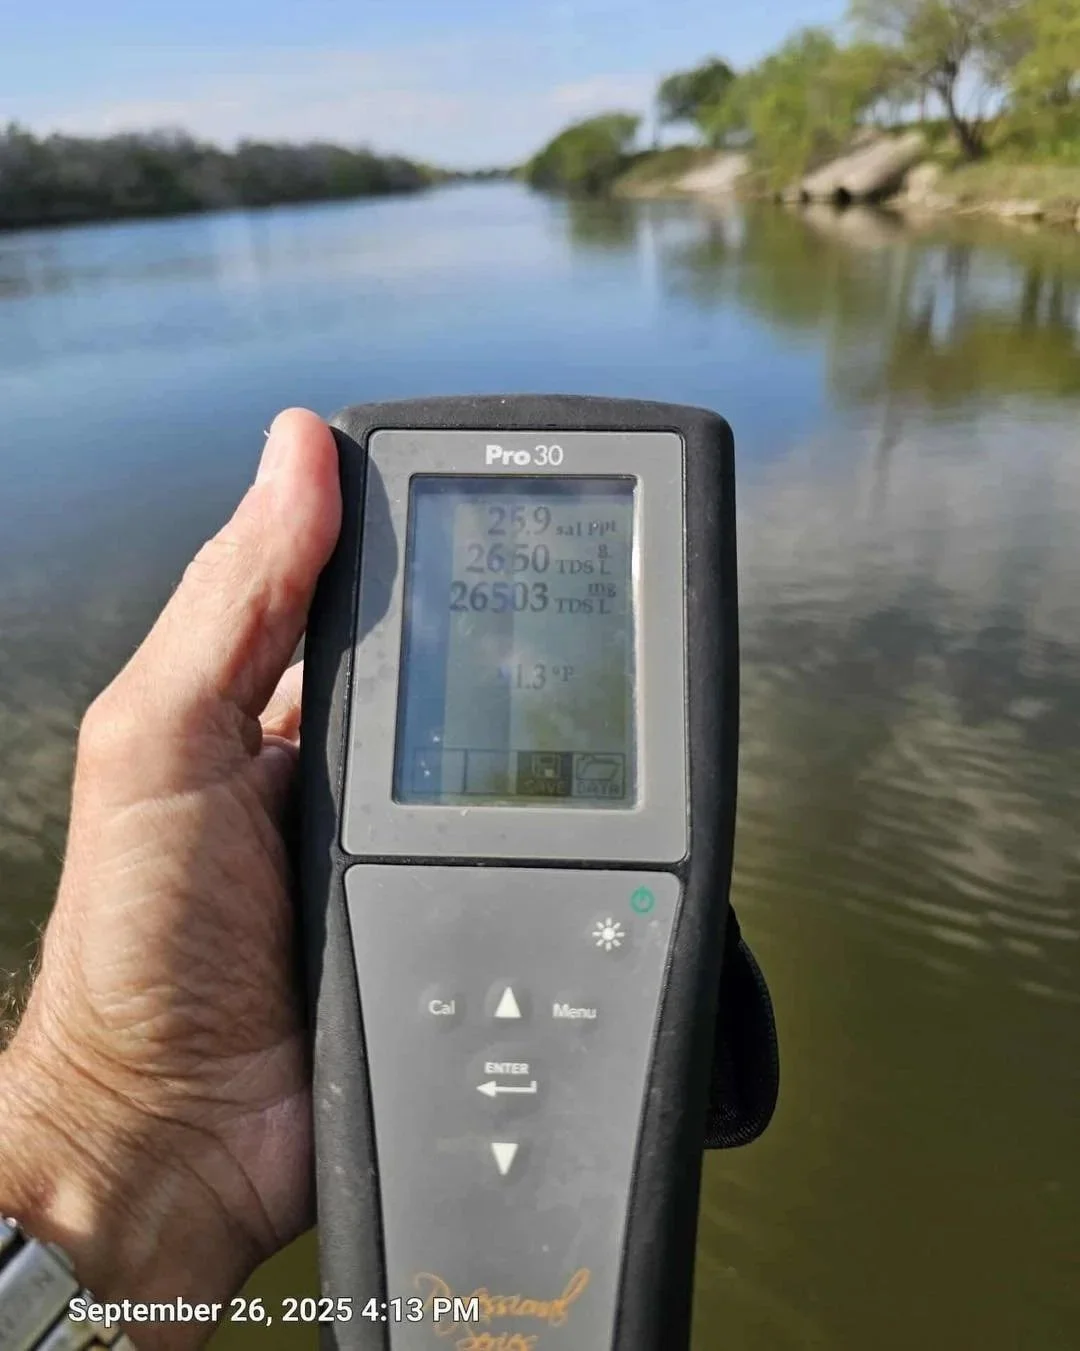
Saltwater Side of Saltwater Barrier Dam (4:13 PM)
Salinity: 25.9 ppt
TDS: 26,503 mg/L
Temperature: 91.3°F


Analysis
The September 26 data shows a clear gradient of increasing salinity and TDS moving downstream toward the saltwater barrier dam, with the highest readings found at and below the structure. The upper river remains mostly fresh to slightly brackish, while near the dam, tidal and saline influences dominate.
After several days of the wells being inactive, salinity levels had declined earlier in the week. However, readings from today show a rebound, with multiple points above 1,000 mg/L TDS again. This pattern highlights how sensitive the lower river is to both surface flow and groundwater interaction.
Why These Measurements Matter
Collecting field data across multiple points helps establish a better understanding of surface water quality trends, natural fluctuations, and seasonal influences. Consistent monitoring allows for early detection of changes that could affect groundwater recharge, aquatic ecosystems, or long-term water supply management in the Nueces River Basin.