
Nueces River Water Quality Update — September 25, 2025
Overview
The Nueces Groundwater Conservation District continues to monitor water quality across multiple locations along the Nueces River. Field readings were taken upstream from the Eastern Well Field, at the well cluster discharge, and downstream near the Hazel Bazemore Boat Ramp. These samples provide a clear comparison of salinity and total dissolved solids (TDS) values along the river system, while the USGS Bluntzer station data provides supporting hydrologic context.
Field Readings — September 25, 2025
Upstream from Eastern Well Field (11:10 AM)
Salinity: 0.6 ppt
TDS: 826 mg/L
Temperature: 83.7°F
Discharge at Well Cluster (10:40 AM)
Salinity: 2.8 ppt
TDS: 3,403 mg/L
Temperature: 80.8°F
Hazel Bazemore Boat Ramp (10:23 AM)
Salinity: 0.7 ppt
TDS: 894 mg/L
Temperature: 84.9°F
All field data was collected using a YSI Pro30 Water Quality Meter, which automatically converts specific conductance to TDS using the standard 0.65 conversion factor.


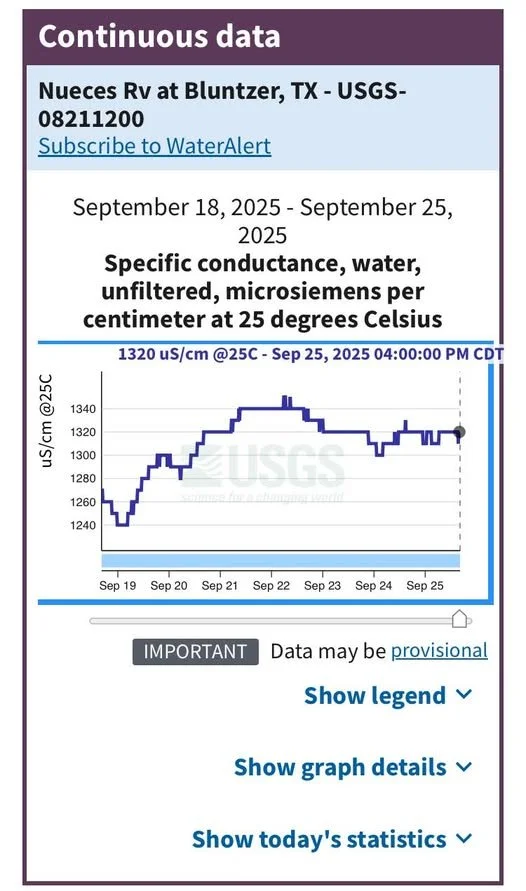
USGS Monitoring Data — Nueces River at Bluntzer (Station 08211200)
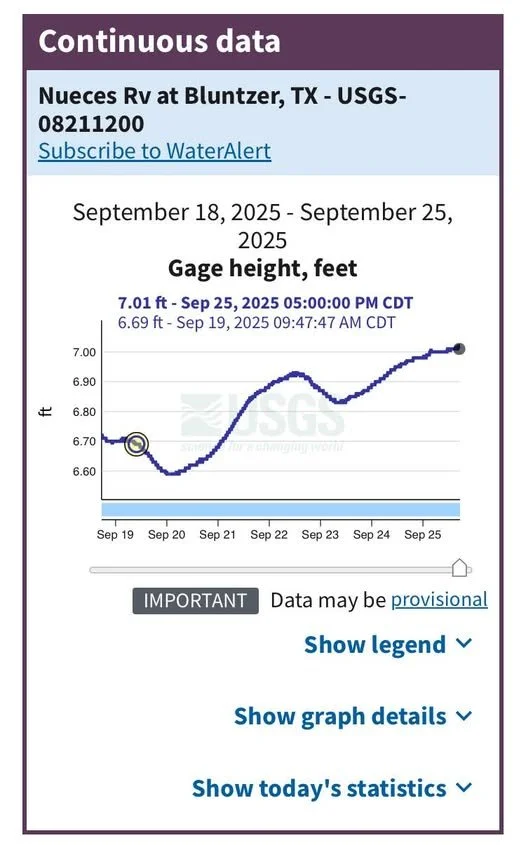
Date/Time: September 25, 2025 – 4:00 PM CDT
TDS: approximately 858 mg/L
pH: 8.2
Dissolved Oxygen: 6.6 mg/L
Specific Conductance: 1320 µS/cm @ 25°C
Gage Height: 7.01 ft (up from 6.61 ft on September 20, an increase of 0.40 ft in five days)
The USGS Bluntzer station, located at the FM 666 bridge before entering San Patricio County, provides continuous public data on river conditions.
Analysis
Data from September 25 shows slight variation in salinity and TDS across sampling points, consistent with natural changes in river flow and groundwater interaction. The increase in TDS at the well cluster discharge indicates localized concentration of minerals and salts, while upstream and downstream readings remain within the range of slightly brackish water.
The USGS monitoring data reflects a minor rise in river elevation over the past five days, suggesting increased flow that can temporarily dilute dissolved solids and improve oxygen levels.
Why This Monitoring Matters
Tracking field conditions and verifying them with USGS monitoring data helps ensure transparency and accuracy in understanding river and aquifer relationships. Regular field observations build a clearer picture of natural fluctuations and support local decision-making about water management and conservation efforts.